On average, more than 80 million photos are shared on Instagram. Instagram has doubled its active community in the last two years. Every excellent Instagram account starts from somewhere, but building an enthusiastic audience community must depend on understanding Instagram Analytics in Instagram marketing.
Do you know how efficient Instagram Analytics is?
Are you aware that Instagram Marketing interacts with the overall marketers?
Would you like to build up an active community for your Instagram account?
All these depend on the understanding of Instagram analytics. Instagram analytics data should inspire your content strategy. Once you adequately understand Instagram analytics, you can only get a clear idea of creating content that will lead to engaging audiences and followers.
Similarly, understanding Instagram Analytics can spark new ideas and a new strategy to generate fantastic content. Anyone can realize Instagram analytics if you follow the guidelines below.
Instagram Profile Analytics
Instagram profiles are limited when compared to other social media accounts. However, the follower count, profile views, and website clicks are the main components of Instagram Profile analytics.
Followers Growth:
The follower’s Growth is located between your profile and posts. Mostly, it is the critical element of your account because anyone goes to it. They initially see the followers count. The follower’s Growth is probably a prominent metric and the first Impression of the Insta account.
Website Clicks:
Including a website URL in your account directly guide your audience to view the website. It helps to gain more traffic to the sites. By clicking this URL, you can track audience engagement in analytics based on how many visited websites.
Profile views:
You can track how many people go through your account and compare the views from the last few weeks. Profile views metric helps you to identify what type of account is yours and who you are.
Instagram Audience Analytics
Before going to the content preference, an Instagrammer should understand the audience’s preferences. The critical factors we should remember when analyzing audience analytics are age, Gender, active hours, active days, and demography.
Age:
Target your audience by age. Age should be the primary factor when targeting the audience. Instagram analytics shows you the exact age of your account followers.
Gender:
You can also sort Gender by using age preferences. Gender is another metric to set your audience and get to know the audience’s preferences. We can also target the audience’s views by Gender.
Active Hours:
Notify your Instagram followers when they are active during certain hours. Under followers, you can see the highly active hours of the audience visiting your profile. Take advantage of this metric to fix the best hours to post.
Active Days:
Find the days in a week when your audience is active and often visits your profiles, like active hours. You can fix the beat days to schedule and post the images.
Demography:
Notify the Instagram follower’s location from where they are viewing your profile. Demography is the simple metric that Instagram insights will show you: the country, city, and exact audience location.
Individual Post Analytics
Instagram Analytics goes beyond the posts, which will get more likes and comments. Instagram post analytics vary visually, depending on how many Likes and comments your post received.
Carousel up to 10 photos:
Allows uploading multiple images in a single post. It offers up to 10 pictures if you are using third-party planner apps.
Likes:
Simplest ways to monitor Instagram post-performance. Track the number of Likes received by a single post. The best way to know is to analyze which content works and which doesn’t.
Comments:
Comments are the next level of engagement for your audience. Notify How many comments a single Instagram post received. It may be positive or negative. It helps to get feedback from the audience regarding your posts.
Next, jump to two-way communication by replying to the comments. Comments are precious gifts from the audience that help to know the post’s engagement.
Saves:
Instagram introduced an extraordinary feature to save other Instagram post’s data. You can easily keep the data to view later and repost your favorite photos from others’ feeds. Track how many people saved your Instagram posts.
Impressions:
Analyze how often your post will be seen and how long the audience stays in your position. If users just scrolled, your post counted as a single impression.
Reach:
Reach and Impression look similar but slightly vary in features. Reach is nothing but the total number of accounts reached your post. Reach is the ultimate metric to monitor how many new accounts visited your profiles.
Engagement:
The number of Instagram accounts reached, liked, and commented on your post. If your post engagement is high, you will get more new followers.
Top Posts:
Instagram posts have earned the highest impressions from Top to bottom for the last 30 days. Top Posts help identify which positions are most trending on Instagram.
Instagram Stories Analytics
Like Snapchat, Instagram also launched Instagram Stories to share your daily activities in short stories. Instagram stories even stay 24 hours later; they disappear. Business accounts can use Instagram in many ways to reach the audience.
Instagram story analytics can be analyzed based on these metrics,
Impressions:
Impressions are nothing but how many people viewed your story and how many times. For example, if one person viewed your account two times. That means we can count it as one reach and two impressions.
Reach:
Several active users who saw your whole story. Reach gives you the overall count of actual users who viewed your account.
Total Interactions:
The total interaction metric shows where users clicked to watch the story, such as hashtags and unique stickers. You provide a shortcut to the other follower to click on a particular image or hashtag.
Tap Forward:
By tapping forward, this metric shows how many users are interested in viewing your next story.
Tap Backward:
Tap backward metric gives you the exact number of people who want to review your story again. Or who would like to watch your previous account by tapping on tap backward?
Replies:
Instagram stories will get replies in some cases, like
If your accounts are engaging or if you’re asking questions of the users,
Sometimes, people leave comments on stories if you post an eye-catching picture.
Too many replies to your story are good signs that you are creating compelling stories.
Exits:
People exit your story without watching it till the end. It can happen for two reasons,
If your Instagram account is closed while listening to the story.
By mistake, if you click on the X mark in the top right corner of the story,
Instagram Video Analytics
The success of the video depends on the number of shares. If the video goes viral, it is a good indication that your Instagram marketing tips are working correctly.
Therefore, the overall campaign of the Instagram video can be concluded by its analytics.
The metrics we consider while analyzing the Instagram video analytics are,
Likes:
The number of likes for a particular video shared on the Instagram account can be identified. This metric helps to know which type of content is most preferred by the audience.
Views:
The video has attained more views for a particular video, which helps to implement advanced strategies to improve audience engagement.
Reach:
If the video campaign has reached a low audience and deep impressions, it can be reposted by adding more content to get a hike on Instagram.
Engagement:
The total number of likes and comments can calculate Instagram video engagement. It can help reach an audience directly, considering the many comments in the video.
Impressions:
An impression will be measured by the total number of times the viewer watches a particular video.
Growth of New followers:
The Growth of the new followers will be measured based on the new followers who arrived for your Instagram video for a particular week, comparing the previous figures.
Mentions:
The Instagram audience who shares your Instagram video by mentioning your username, which generates more impressions of a single activity, will be measured.
Filters:
Filters arrived on Instagram to add special effects to the videos. It can be estimated by which type of filter is most responded to by the audience, which drives real-time traffic to the video.
Response Rate:
It can be notified by considering the audience’s response through comments and likes.
Instagram Ad Analytics
Instagram Ad Analytics consists of 5 significant metrics.
Visit Website:
The Website link in the bio section of the Instagram account was clicked three times. It happens twice by Organic search—one time, as we would expect from the Instagram ads.
Interactions:
The interactions take place by clicking on the ads displayed on KPIs. We can expect 40% of the Organic search and 605 from the paid ads.
Impressions:
Impressions it is different from the organic search. In this case, not every person sees your posts once or twice. It depends on the amount you spend on Instagram ads. Here, you expect 58% of the reach from the Instagram ads.
Follows:
Here, we cannot differentiate how many followers came for paid ads and how many for regular engagement. You can only analyze and count how many new followers reached your account for a particular day or week.
Discovery:
This metric displays how many people reached your Instagram account from your sponsored brands. In this case, we could also expect 58% of the sponsored ads and 42% from the Organic Reach.
Instagram Analytics Tools
SocialBakers:
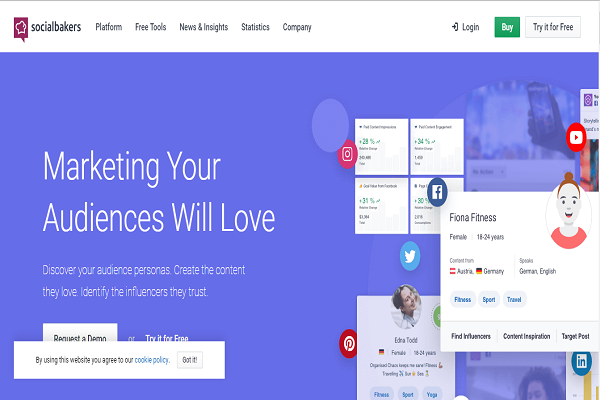
SocialBakers is the best tool if you are a visual person. The graphical reports break down your top posts, hashtags, and filters. The most comprehensive design centered around delivering the right analytics at the right time.
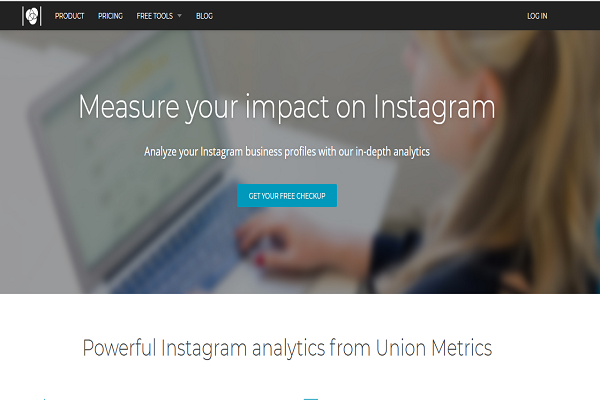
Union Metrics:
Union Metrics dashboard design with a user-friendly interface. It gives you a clear idea of the type of hashtags you must include and the content you should focus on.
Pixels :
Pixel gives free weekly reports displaying each day’s activity of an audience, new followers, post engagements, hashtag popularity, etc.
Instagram Insights:
Instagram Insights get with your Instagram business account. It displays basic charts about your posts, stories, profile views, and conversions.
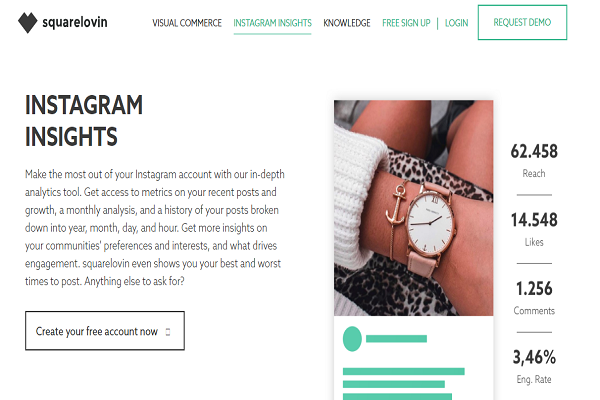
Squarelovin :
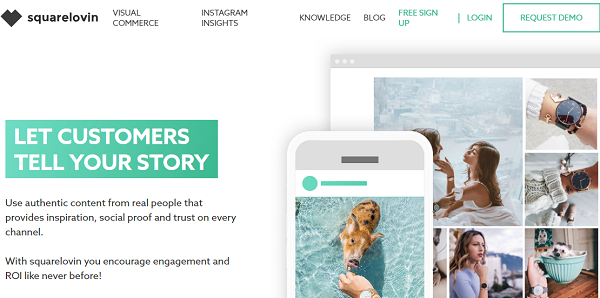
Squarelovin is the best platform for looking for a UGC for your Instagram account. This built-in analytics tool allows users to connect multiple account managers with the app.
Sprout Social :
Sprout Social analytics allows you to monitor brand data performance. One of the best features of Sprout Social is that it can also display competitors’ Instagram analytics reports.
Pture.io :
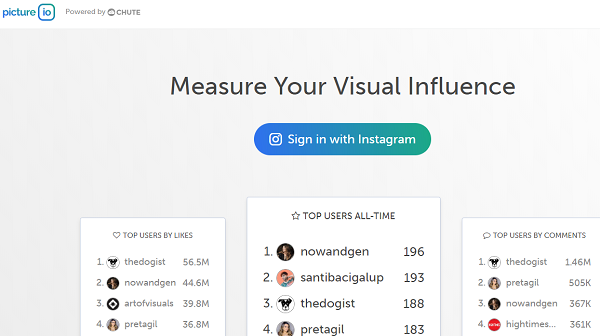
Free Instagram analytics tool for visual content is simple to connect with an Instagram account and gives an influencer score. Here, the Influencer score measures visual content’s impact and the creators’ impact.
Measured :
The Measured free Instagram analytics tool provides detailed graphical reports to the Insta account, which has less than 25,000 followers.
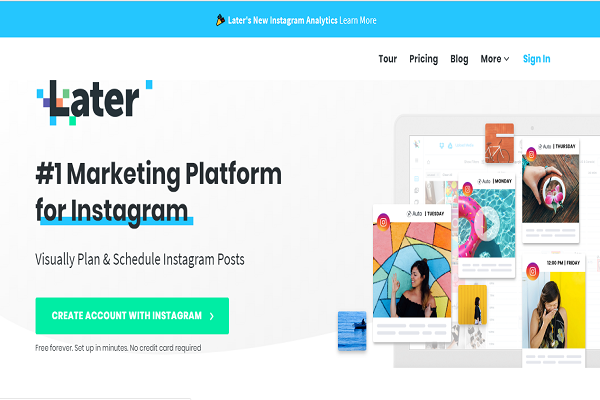
Later :
Best Instagram Analytics tool and scheduling tool to manage your account. Not only scheduling but also measuring the performance of your account and giving you detailed analytics.
TapInfluence :
TapInfluencer Instagram analytics tool enables you to manage campaigns, find influencers, and offer Instagram analytics.
iconosquare:
![]()
Keyhole:
Hypeauditor:
Quantity:
Squarelovin:
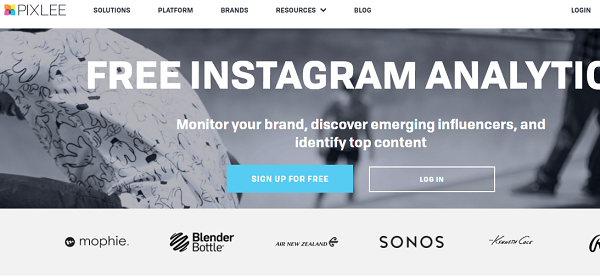
Pixlee:
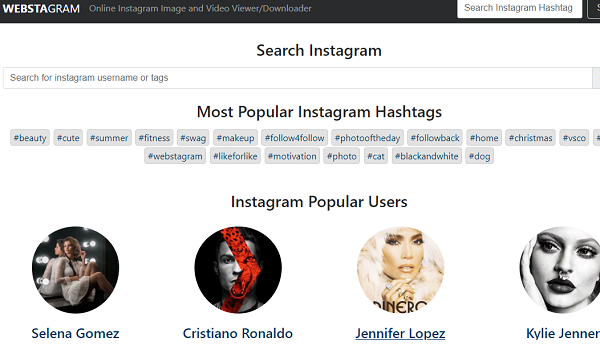
Webstagram:
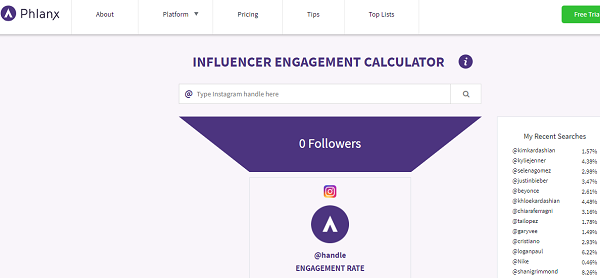
Phalanx:
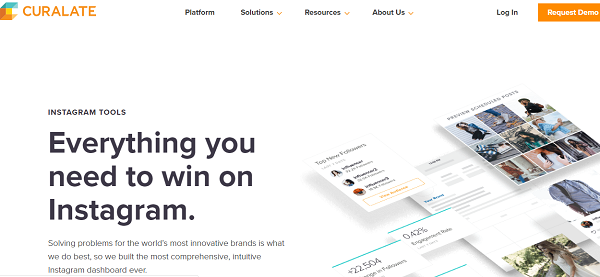
Curalate:
Picture.io:
Minter.io:
Dash Hudson:
Instagram Story Analytics:
Instagram story insights are alive up to 14 days after publishing a story. The interactions, including profile visits, replies, and sticker taps, can be found. Discovery lets you see the number of Insta accounts viewed in your story, including impressions and follows. It is entirely free to access.
Social Rank:
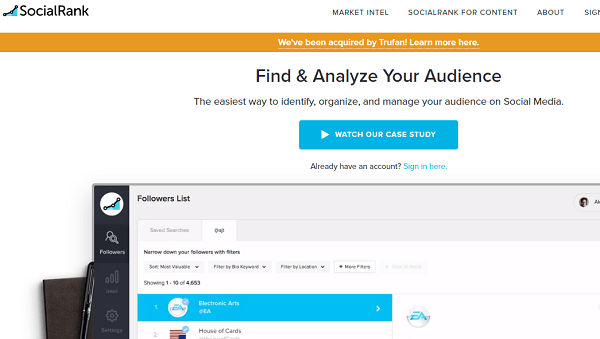
It provides the Instagram audience metrics in detail. Through this, businesses can update and deliver their content according to the audience pattern Social Rank gives.
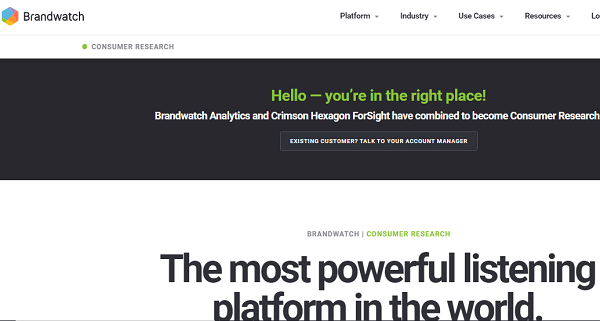
ForSight:
The added benefit is that you can make sentiment analysis by your posts and images. Additionally, you can build the world-cloud.
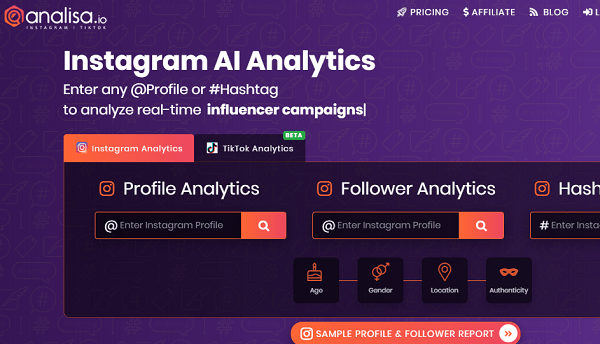
Analisa.io:
Using it, you can analyze Hashtags, Profiles, followers’ demographics, campaign reports, engagement analysis, content analysis, competitive analysis, etc.
Popular Chips:
The users can gain traction on Instagram through a complete analysis generated by Popular Chips. It offers analytics like most followed, Quality score, Top by country, top influencers by government, trending influencers on Instagram, and trending topics.

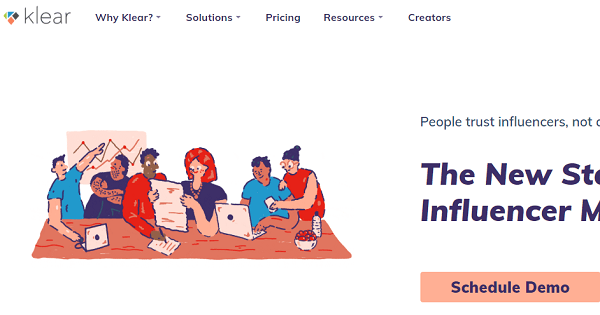
Klear:
It is the most helpful tool to engage your audience through influencer research. The audience insights, engagement, influencing score of social media channels, demographics, etc., can be found.
SocialBook:
The most powerful influencer marketing tool where brands and influencers can quickly analyze the performance of their campaign on Instagram. If possible, we can analyze influencer profiles, performance reporting, bulk email outreach, KPI tracking, trend alerts, competitor comparison, etc.

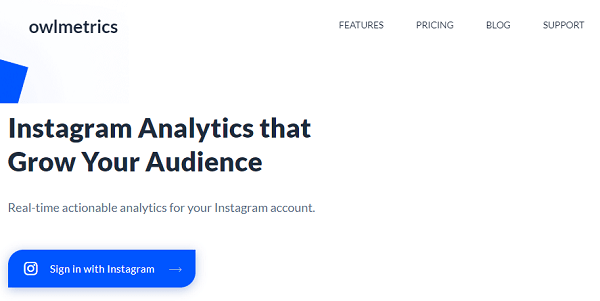
Owlmetrics:
It is a single-stop solution for all Instagram analytics. This is where you can find the followers’ Growth, hashtag performance, click-through rates, audience engagement, competitor engagement, etc. Tracking all your Instagram data is only possible through Owlmetrics.
Conclusion
Instagram marketers have dozens of Instagram analytics tools offered free of cost. Some Insta Marketers don’t know how to choose the best one and how to work with that interface. Here, we have compiled an ultimate guide to Instagram Analytics and the best tools.
Please email us at info@dotndot.com or call us at +919848321284.

